


Monitoring a Spring Boot application is an essential aspect of ensuring its stability and performance in production. It helps you detect and diagnose problems early, thereby reducing downtime and ensuring your users have a seamless experience.
Methods of monitoring a Spring Boot application
Application Metrics: Spring Boot provides a built-in metrics system, allowing you to collect various metrics about your application, such as heap memory usage, CPU utilization, and request count. You can easily access these metrics through a REST endpoint and visualize them using tools such as Grafana or Prometheus.
JMX (Java Management Extensions): JMX is a technology that provides a way to monitor and manage Java-based applications. Spring Boot provides JMX support, allowing you to monitor various aspects of your application, such as memory usage and thread count, through JMX tools.
Application Monitoring Tools: There are various third-party tools available that allow you to monitor your Spring Boot application, such as New Relic and AppDynamics. These tools provide a comprehensive view of your application performance, including metrics, logs, and health checks, in one place.
In this blog, we will explore the Application Metrics method.
To enable metrics in your Spring Boot application, you simply need to include the Spring Boot Actuator dependency in your project.
Actuator provides a set of endpoints, including the /metrics endpoint, that allows you to access the metrics of your application.
You can also use third-party tools such as Micrometer to collect and visualize your metrics. Micrometer provides a unified API for collecting metrics and integrates with various backends, such as Prometheus
Prometheus
Prometheus is an open-source systems monitoring and alerting toolkit.
It has a multi-dimensional data model with time series data identified by metric name and key/value pairs.
It has a simple yet powerful data model, allowing it to store and query massive amounts of data with a high level of dimensionality.
Prometheus provides a functional query language called PromQL, which allows users to ask complex questions of their data. It is commonly used for monitoring and alerting of microservices-based applications.
Download Prometheus from https://prometheus.io/
configure the prometheus.yml and start prometheus
  - job_name: 'Spring Boot Application input'
    metrics_path: '/actuator/prometheus'
    scrape_interval: 3s
    static_configs:
      - targets: ['localhost:8752']
        labels:
          application: 'My Spring Boot Application'
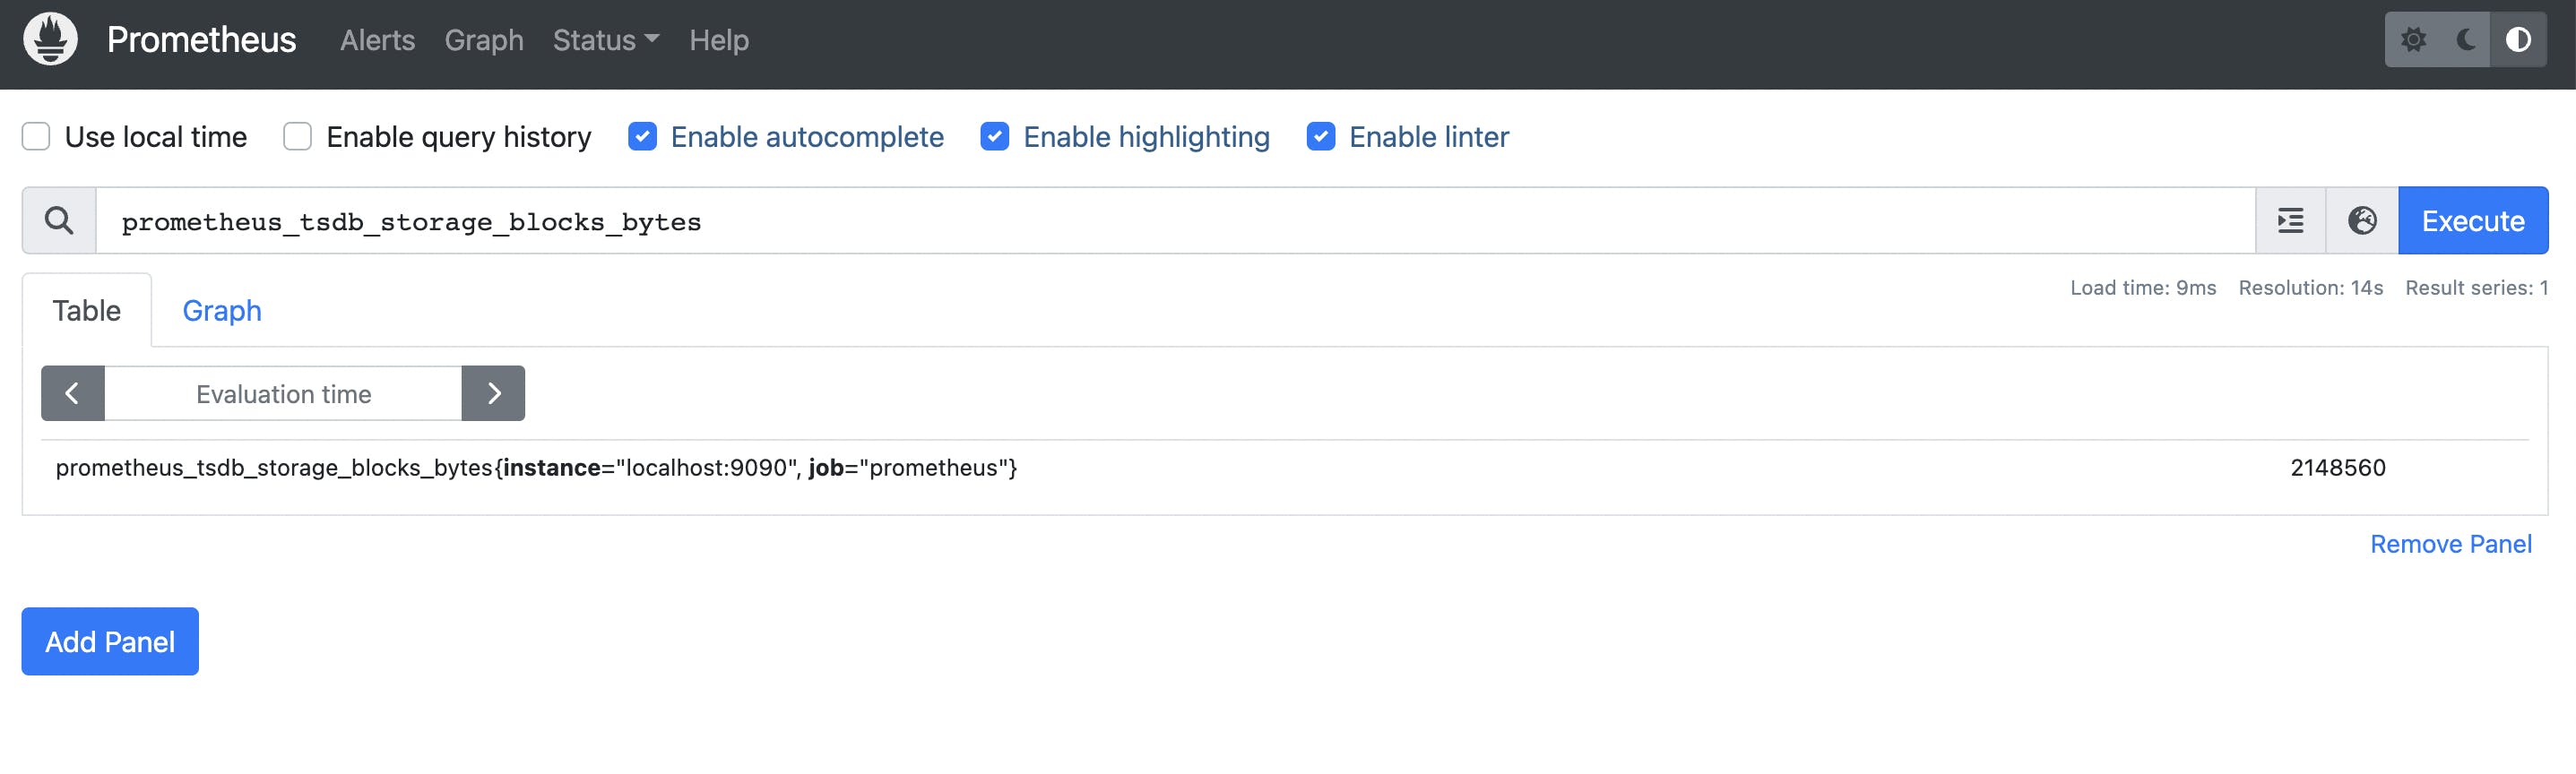
You can check the Prometheus console from http://localhost:9090/
Prometheus server exposes a variety of metrics that give insight into the performance and behavior of the server itself
prometheus_build_infoprometheus_tsdb_storage_blocks_bytes
Prometheus can show basic graphs, but you might consider connecting it with Grafana
There are several reasons why one might connect Prometheus with Grafana:
Visualization: Grafana provides a rich and flexible visualization platform that can be used to create custom dashboards and charts to display Prometheus metrics. With Grafana, users can easily create bar charts, line charts, heat maps, and other types of graphs to visualize their data in a meaningful way.
Alerting: Grafana can be configured to trigger alerts based on Prometheus metrics, allowing users to set up notifications for important events such as increased latency, increased error rates, or other key performance indicators.
Data exploration: Grafana provides a user-friendly interface that makes it easy to explore large datasets and perform ad-hoc queries. With Prometheus as the data source, users can quickly and easily find the information they need to troubleshoot issues or make data-driven decisions.
Dashboard sharing: Grafana provides a way to share custom dashboards with other users, making it easier to collaborate on monitoring and analysis tasks.
By connecting Prometheus with Grafana, users can take advantage of the strengths of both tools to create powerful and flexible monitoring and analysis systems.
While Prometheus does have built-in alerting capabilities, Grafana provides a more comprehensive and user-friendly platform for alerting and visualization.
Grafana
Download from https://grafana.com/grafana/download?platform=mac or with brew
brew install grafana

brew services start grafana
Open grafana with http://localhost:3000/
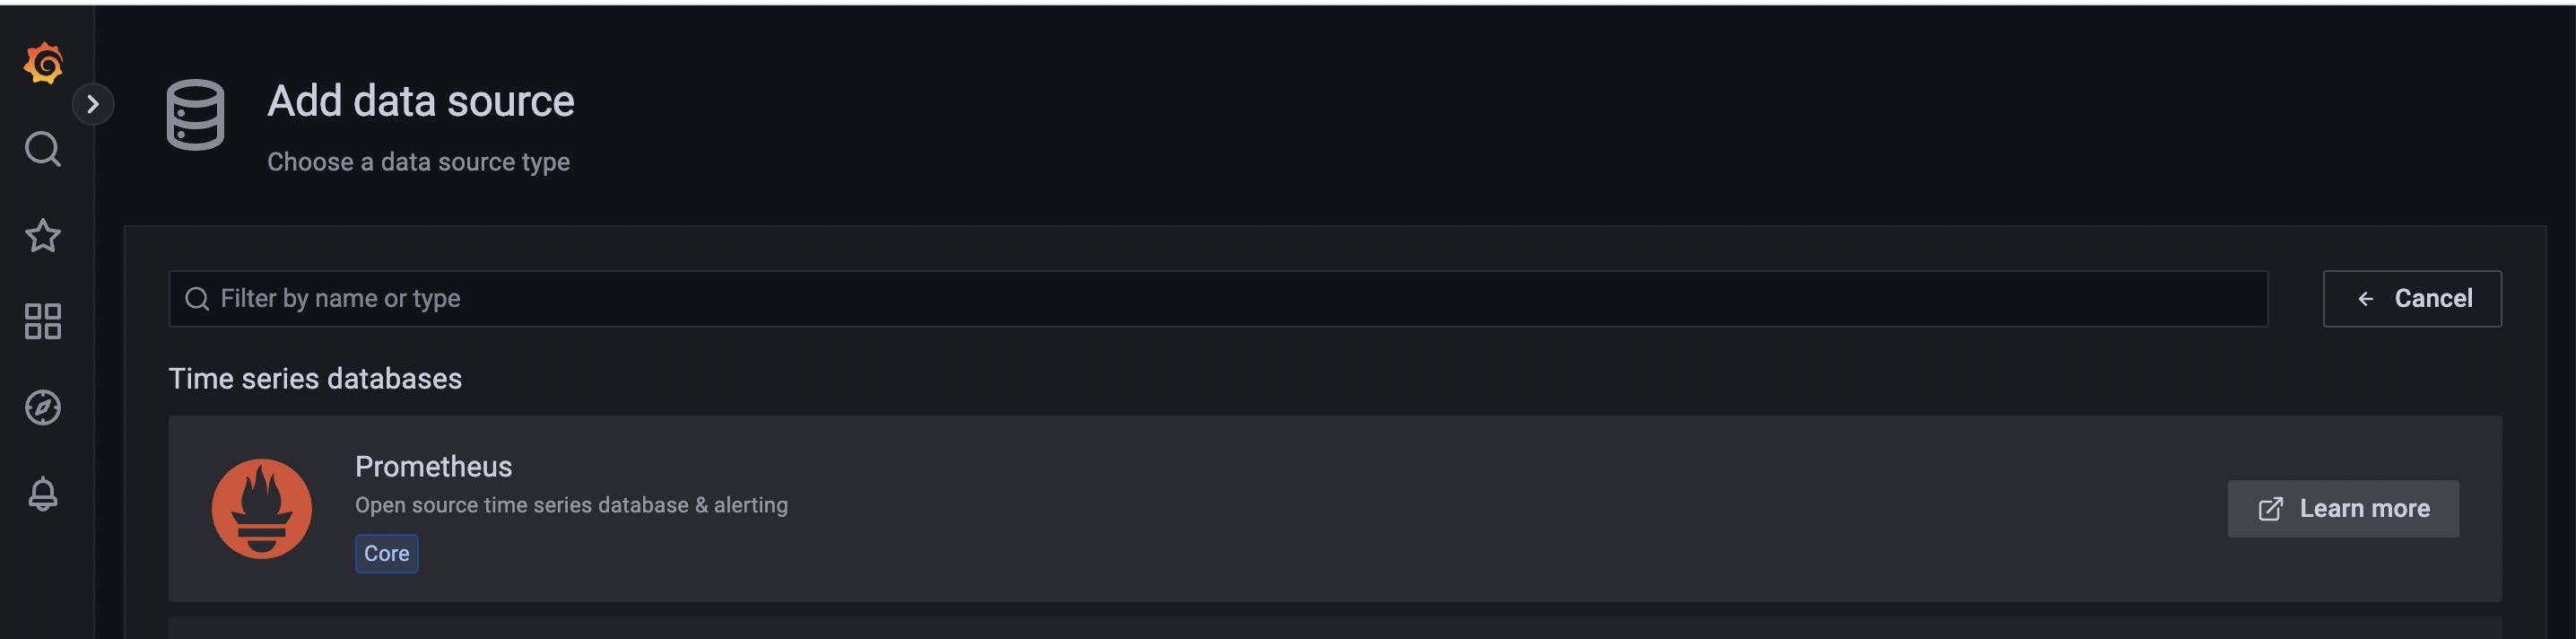
Connect Grafana with Prometheus. Settings --> Data Source --> Add Data Source
Import a Predefined Dashboard in Grafana
Go to Dashboards -> New Dashboard -> Import.
https://grafana.com/grafana/dashboards/12900-springboot-apm-dashboard/
Add the dependency to your spring boot application and run it.
You need to have actuator and Prometheus dependency in your pom.xml or gradle file
<dependency>
    <groupId>org.springframework.boot</groupId>
    <artifactId>spring-boot-starter-actuator</artifactId>
</dependency>
<!-- Micrometer Prometheus registry  -->
<dependency>
    <groupId>io.micrometer</groupId>
    <artifactId>micrometer-registry-prometheus</artifactId>
</dependency>
management:
  endpoints:
    web:
      exposure:
        include: health,prometheus,metrics
Expose Prometheus and metrics endpoints for the actuator
Make sure you are getting proper responses from these endpoints.
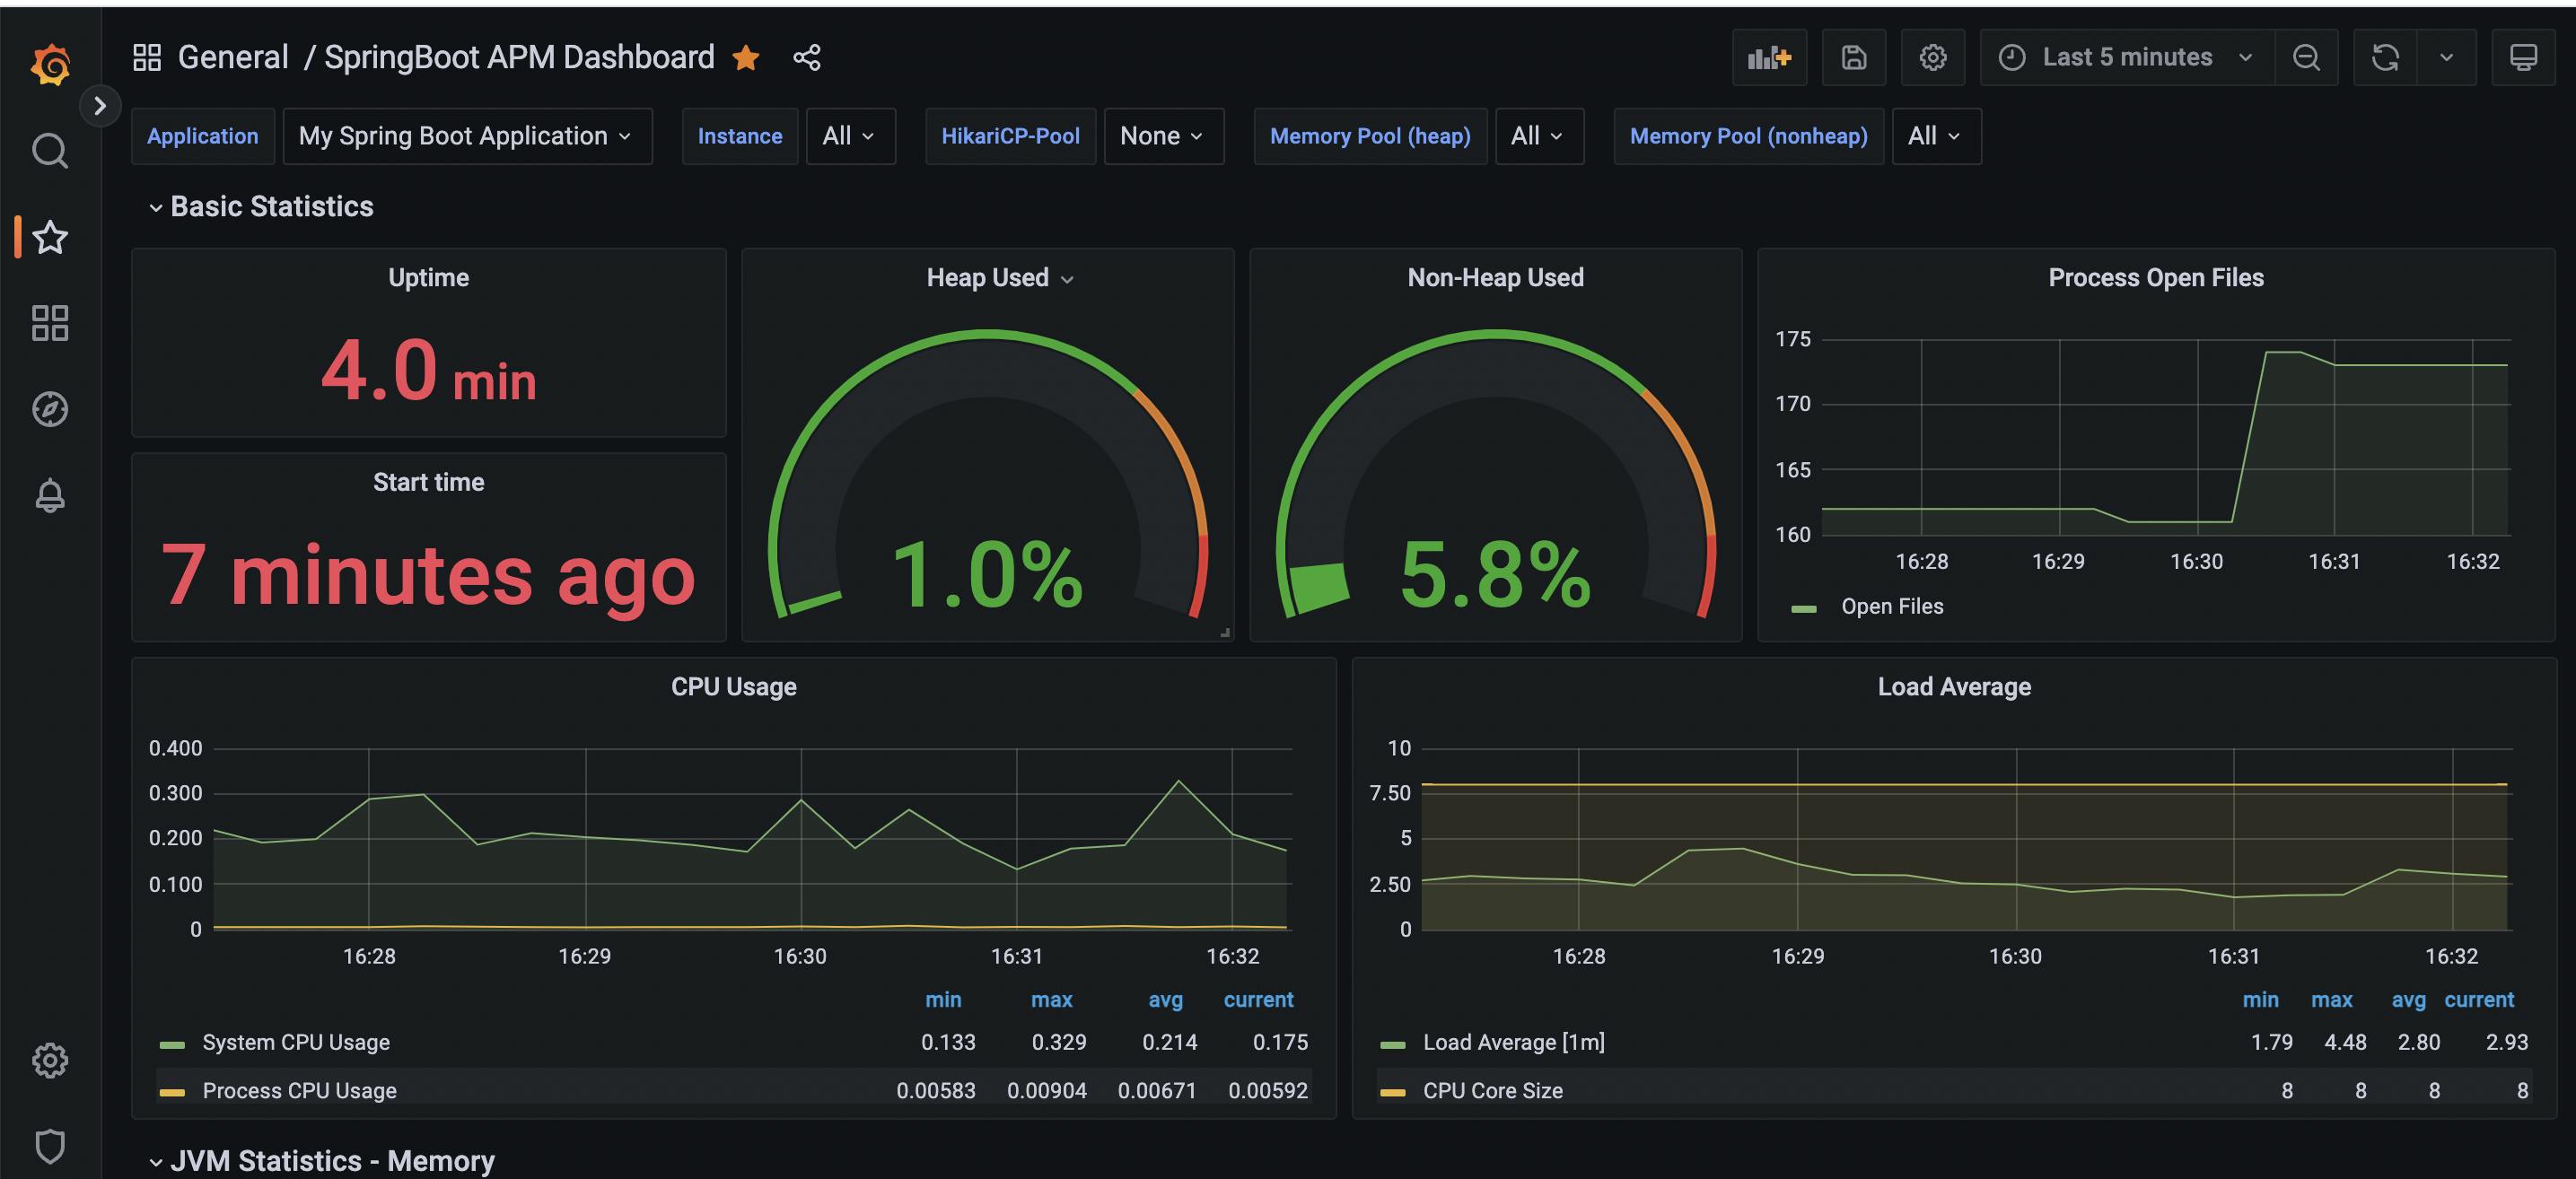
Open grafana and check the dashboard
Conclusion
Application metrics are a crucial aspect of monitoring a Spring Boot application. By monitoring metrics, you can ensure that your application is running smoothly and identify potential issues before they become major problems. The built-in metrics system in Spring Boot, along with third-party tools such as Micrometer, make it easy to collect and visualize metrics in your application.
Github Link for code sample: https://github.com/nkalra0123/spring-boot-monitoring
If you liked this blog, you can follow me on twitter, and learn something new with me.